The 10-step model to prove Event ROI and value
Your Exec roundtable was a smash!Sales are buzzing. Then the CFO asks: “Great - what’s the ROI on that $75k?” If your stomach flips, this one’s for you.
Thesis: Events absolutely work for ABM. But they only win budget if you prove acceleration, expansion and competitive lift with a defensible method (not vibes).
ABM fit: Events concentrate the right people from named accounts and enable intimate, account-specific experiences—owned or third-party. That’s why they’re a natural ABM lever.1
Format shift: The fastest-growing event type globally is small, hosted/owned in-person—because intimacy and measurability beat spectacle.2
Measurement gap (your opportunity): Many teams still can’t prove ROI. 36% are unsure, and 18% report no measurable ROI. If you can show rigorous proof, you stand out (and keep the budget).3
1 Demandbase2 Forrester3 B2BMarketing
Traditional first / last / multi-touch models were built for volume plays. ABM events are progression engines for in-flight accounts. Switch to a cohort + counterfactual approach:
Define cohorts (per event/program):
Treatment cohort: Named accounts with verified attendance/meeting
Matched control: Similar-named accounts (tier, region, ICP) that did not attend
Measure deltas over 30/60/90 days:
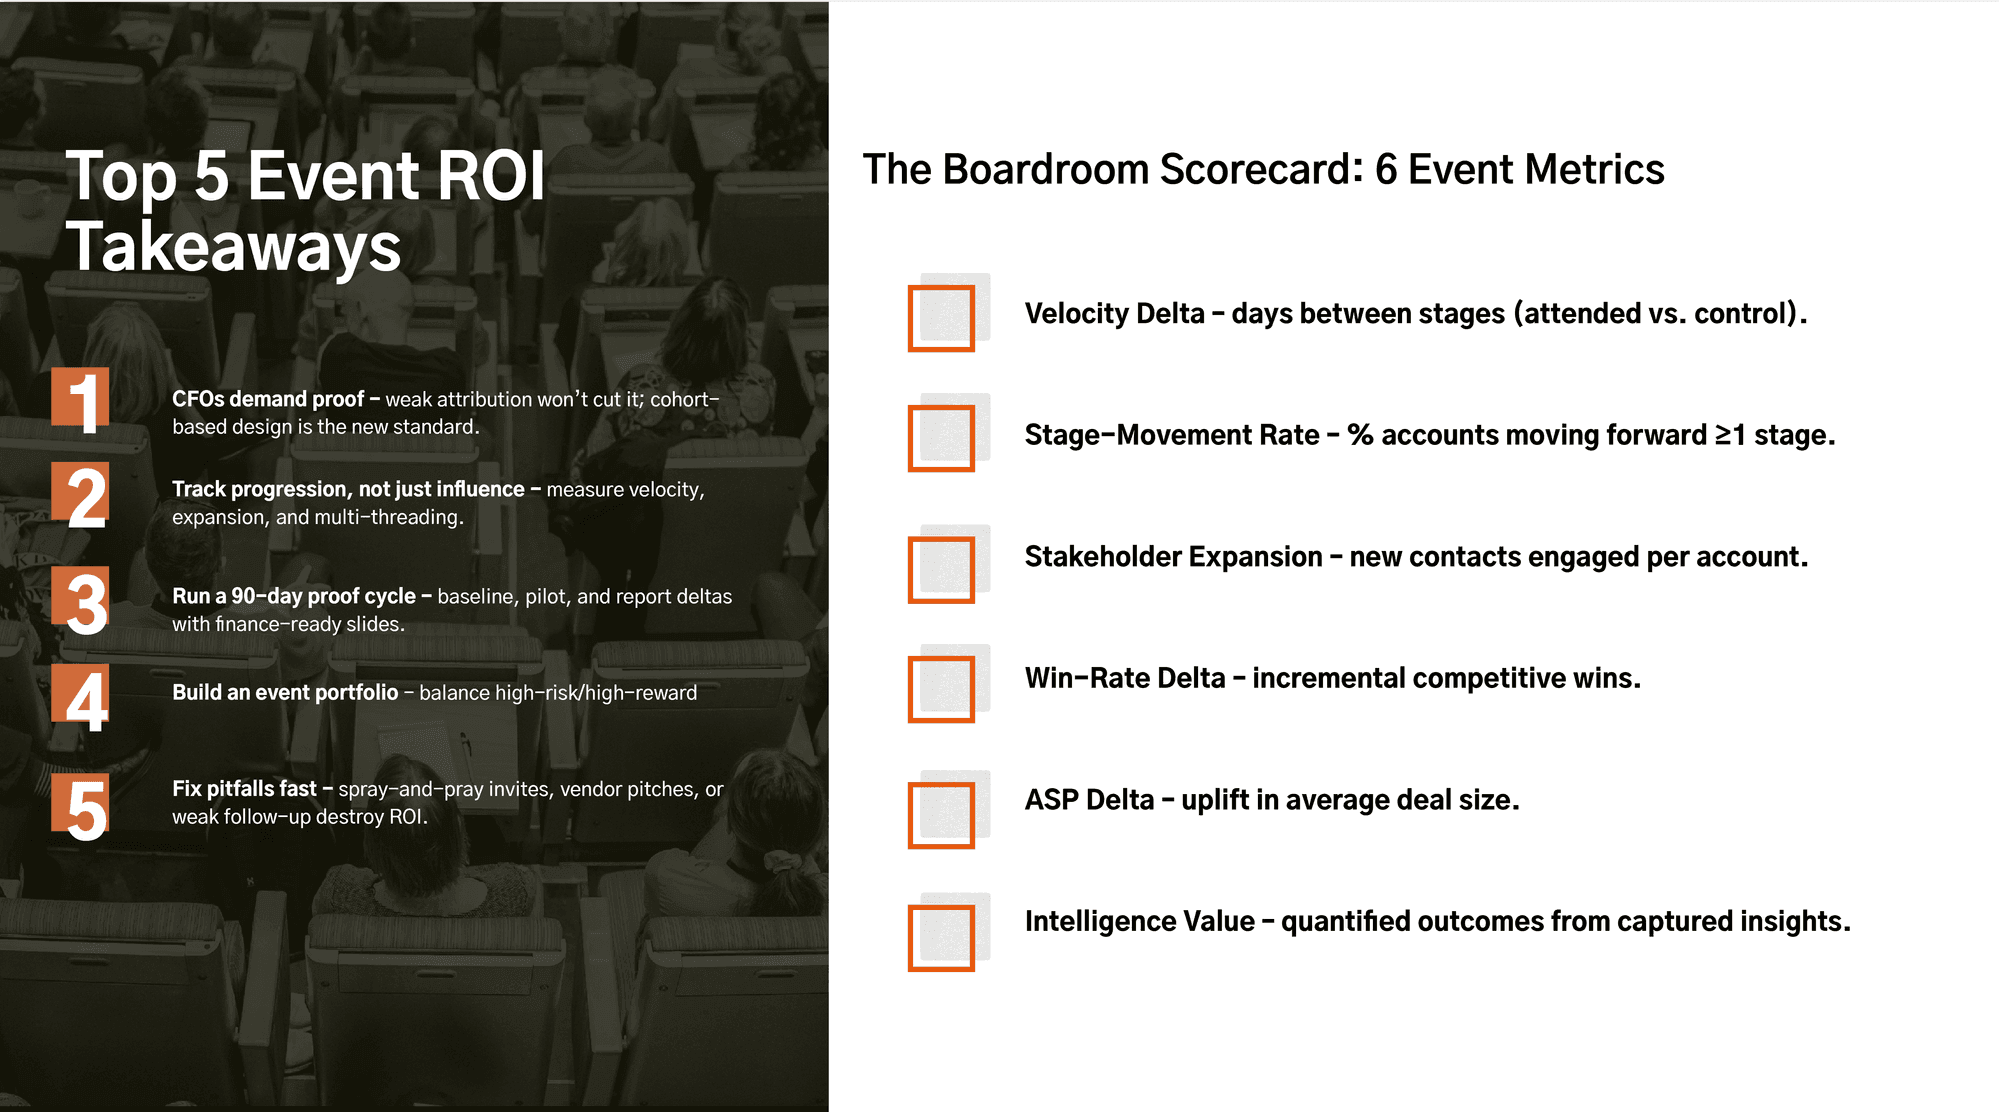
Velocity delta: Median days between stages (Attended vs. Control).
Stage-movement rate: % of accounts advancing ≥1 stage.
Multi-threading delta: Net-new stakeholders added per account.
Win-rate delta (competitive only): Wins / opportunities.
ASP delta: Average selling price difference.
4 5
4 AdRoll5 Goldcast
Account-level signals (CRM/ABM platform):
Attended? Who? Seniority/persona mix.
Meeting density: Meetings per attending account (incl. side events).
Intent lift: Post-event vs. non-attending peers.
Stakeholder expansion: Net-new contacts engaged in 30 days.
Contact-level (CRM notes, structured fields):
Pain points, objections, timeline, budget confirms, competitive mentions.
Next best action + Mutual Action Plan (MAP) owner and due date.
Vendor research reinforces that teams who operationalize these signals are far likelier to attribute revenue to events (86% among event-led growth adopters) . 6 7
6 Cven. 7 Splashthat
Give Finance conservative bands with sources and note variability by city, venue, and format:
Trade-show presence (space + booth): rough ranges from $5k–$50k+ depending on size/design;
Executive dinner catering: corporate ranges commonly $75-100+ per head (excl. venue, AV, staff).
Use these to set caps and to plan a portfolio (below).
Switch to a cohort + counterfactual approach. This reframes events from ‘influence’ to advance — exactly the standard a CFO wants.
Event ROI = (Accelerated Revenue + Deal Expansion + Competitive Win Delta + Intelligence Value + CLV Delta) ÷ Total Event Investment
Accelerated Revenue: Revenue recognized earlier due to velocity delta (Attended vs. Control).
Deal Expansion: Additional scope tied to stakeholder expansion and mapped in opp change logs.
Competitive Win Delta: Incremental wins in competitive scenarios for Attended cohort.
Intelligence Value: Quantified value of captured signals (e.g., Q3 renewal intel) if they led to concrete actions and outcomes.
CLV Delta: Long-run cohort uplift if you maintain longitudinal tracking (18–24 months). (Replace “pipeline created ÷ event cost.” That’s lead-gen math; this is account progression.)
Industry context: In-person remains effective and portfolios are expanding; execs expect clearer ROI frameworks like the above . 8 9
8 Bizzabo9 Corporate Event News
Days 1–30: Baseline & design
> Export 12 months of deals to baseline velocity by stage, win rates, ASP by tier.> Build matched-control logic with RevOps (document criteria).
> Configure capture: Attendance → account, meetings, notes (structured).> Lock the follow-up SLA (48-hour MAP for Tier-A).> Exec roundtable (8–10 accounts), conference ABM program (20–30), single-account workshop (1:1).> Pre-book meetings; run a concierge desk; log all intel same-day.
Days 61–90: Report deltas> Velocity, stage-movement, stakeholder expansion, early win-rate deltas vs. control. > Build a one-slide Investment Case: “Acceleration + Expansion” in dollars.> Annotate risks and next experiments.
Why this convinces: it directly addresses the market-wide measurement gap and shows you can attribute revenue - behaviours linked with higher growth among event-led teams.
Don’t bet the budget on one format - allocate like a VC:
High-risk / high-reward (1:1 EBC, single-account workshops): Use for must-win, late-stage deals; strict gates and exec time.
Medium-risk / consistent (industry roundtables, vertical clinics): Use for mid-stage multi-threading and consensus building.
Lower-risk / scale (conference ABM programs + side events): Use for early-stage sourcing from the named list.
Match to the choices laid out in your portfolio article (owned vs. rented; 1:1 / 1:few / 1:many) and to your before/during/after runbooks.
> Spray-and-pray invites: Seat-filling ≠ ABM. Fix with intent + fit filters and AE/exec sends. 10> Bait-and-switch content: Vendor pitch kills trust (and future engagement). Keep panels/customer proof; cut monologues.> One-and-done day: Most value is created before and after (targeting, pre-booking, 48-hour SLAs). Industry playbooks are explicit here. 11
10 Adroll11 Goldcast
Attribution + CRM: Attendance bound to account/opportunity; stage timestamps for velocity.
ABM platform: Intent + firmographic targeting; remarketing to attending accounts only.
Event ops: Structured note capture → CRM (fields, not blobs), calendar → MAP templates.
Dashboards: Exec view (coverage, velocity delta, wins), Sales view (hotlist + MAP), Marketing view (meeting density, format ROI).(Market trend: portfolios leaning back into in-person while leadership demands clearer ROI instrumentation.)
12 Adroll13 Bizzabo
> Conservative model: “If just 2 of 10 target accounts close one quarter faster, accelerated revenue is $X; total investment $Y → X/Y ROI on acceleration alone. Expansion and win-rate delta not yet counted.”> Historical proof: “Here’s our cohort delta vs. matched controls; velocity, stage-movement, ASP. Same method we’ll use next quarter.”> Risk controls: “We’ll pilot 3 events, publish deltas, then scale only what clears the threshold.”
Supplement with market data: “Marketers are doubling down on small hosted events (fastest-growing format), but 36% still can’t prove ROI. Our program fixes precisely that.14”
14 Forrester
Appendix: one-page method (drop into your deck)
Events are not a “marketing expense”; they’re a revenue investment - if you instrument for acceleration, expansion, and wins. Prove that in 90 days with the cohort method above, and your next budget conversation gets a lot easier.
Sources
Demandbase (Jon Miller). Why events fit ABM and the owned vs. third-party frame. (Demandbase)
Forrester. 58% plan more small hosted in-person events—fastest-growing type. (Forrester)
Cvent × B2B Marketing (2024). 36% unsure of ROI, 18% no measurable ROI. (B2B Marketing)
Splash / Corporate Event News. ELG teams: 86% can directly attribute revenue to events. (corporateeventnews.com, Cvent)
Bizzabo industry stats (directional portfolio context). (Bizzabo, corporateeventnews.com)
RollWorks & Goldcast ABM event playbooks (targeting, pre/during/post, metrics). (AdRoll ABM (formerly RollWorks), Goldcast)
Cost bands: booth/space/catering references. (expodisplay, EMS Events)